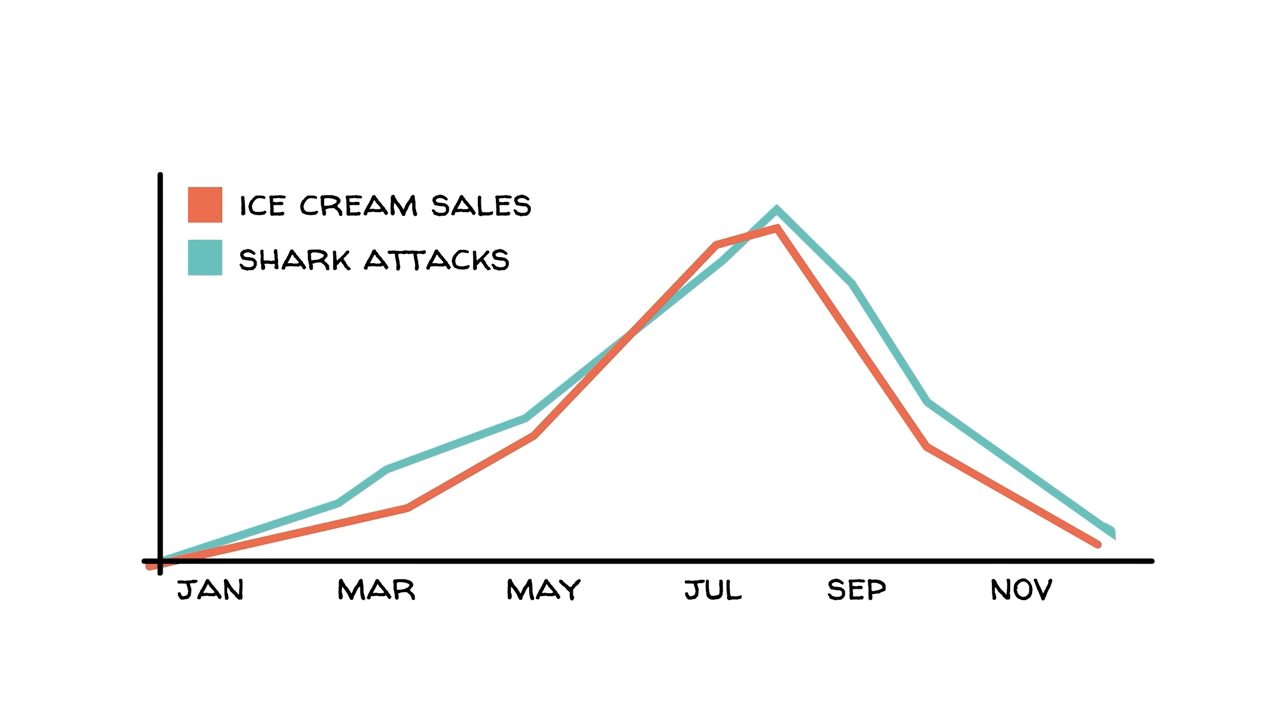
Ice cream sales rise, and shark attacks rise with them. Both fall again later in the year. Does that mean buying ice cream causes shark attacks?
A graph can show that two things move together. Explaining why they move together takes more work. Understanding the difference between correlation and causation helps us evaluate claims in science, news headlines, and everyday life without getting carried away by a convincing pattern.
Key Takeaways
- Correlation describes how variables move together; causation means one produces a change in another.
- Confounding, reverse causality, and chance can make a pattern look causal when it is not.
- Test causal claims by examining time order, possible common causes, and a plausible mechanism.
- Research methods strengthen causal reasoning by creating fair comparisons and tracking changes over time.
What Is the Difference Between Correlation and Causation?
Correlation means two things vary together. When one changes, the other tends to change in a recognizable way. Causation means a change in one thing produces a change in another.
Imagine two children on swings, moving back and forth together. Their movements may be correlated. Now imagine one child pushing the other. That push causes a change in the swing’s movement.
Real causal relationships are often more complicated than a single push. One cause can have several effects, and those effects can be strongly or weakly related to one another.
Warm weather, for example, can encourage people to buy ice cream and go swimming. More swimming creates more opportunities for encounters with sharks. Ice cream sales and shark attacks can therefore follow a similar seasonal pattern without either causing the other.
Correlation Has Both Direction and Strength
Not all correlations look alike. First, consider their direction:
- Positive correlation: Two things tend to increase or decrease together, like ice cream sales and shark attacks in the seasonal example.
- Negative correlation: As one increases, the other tends to decrease. Think of ice cream sales and raincoat sales under changing weather conditions.
- Zero correlation: There is no clear relationship, as we might expect between ice cream sales and the number of pirates worldwide.
Correlation also varies in strength. The closer the observations follow a consistent pattern, the stronger the correlation.
- Weak: Hours spent playing video games and slices of pizza eaten might have a loose relationship, with plenty of variation.
- Strong: Time spent studying and test scores can show a much clearer relationship.
- Perfect: If socks are always produced in matched pairs, the numbers of left and right socks rise together exactly.
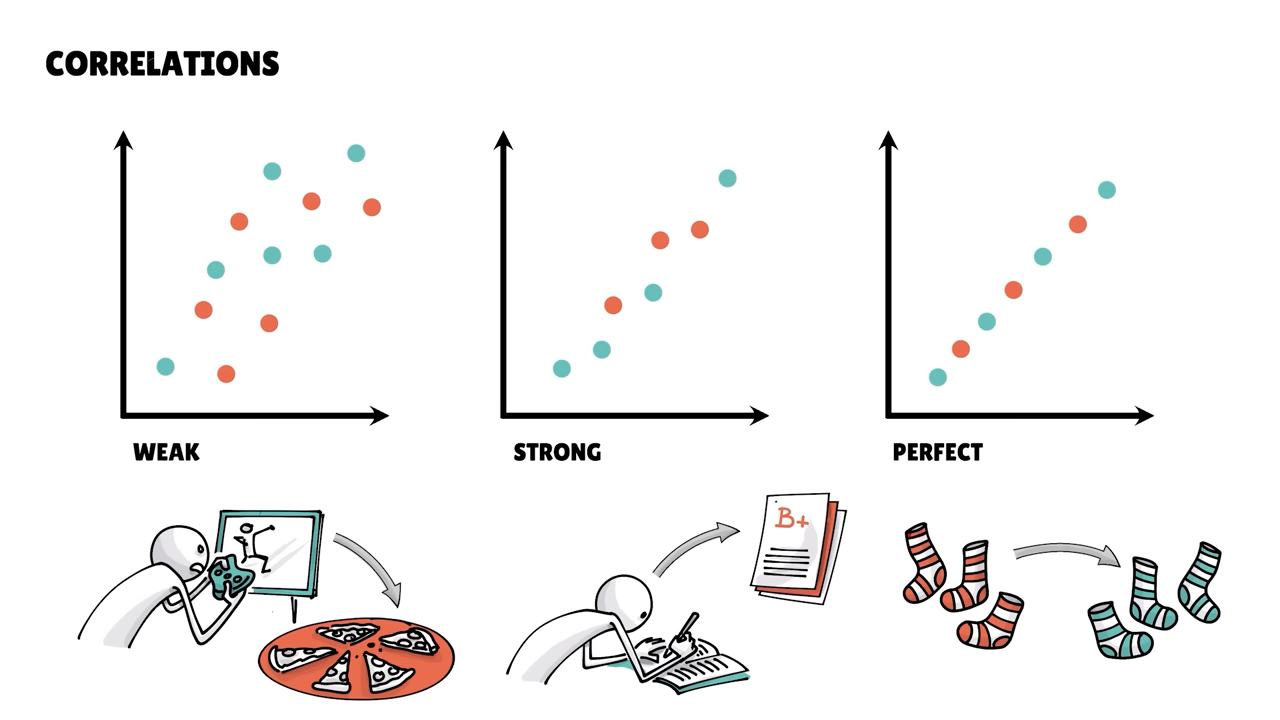
Here is the important part: even a very strong correlation does not, by itself, establish causation. Strength tells us how closely two variables move together, not what makes them move.
Three Ways Correlation Can Mislead Us
Our brains like simple stories: X causes Y. When a clear pattern appears, we can jump to that explanation before considering alternatives. Three common pitfalls are especially useful to recognize.
1. Confounding: A Third Factor Affects Both
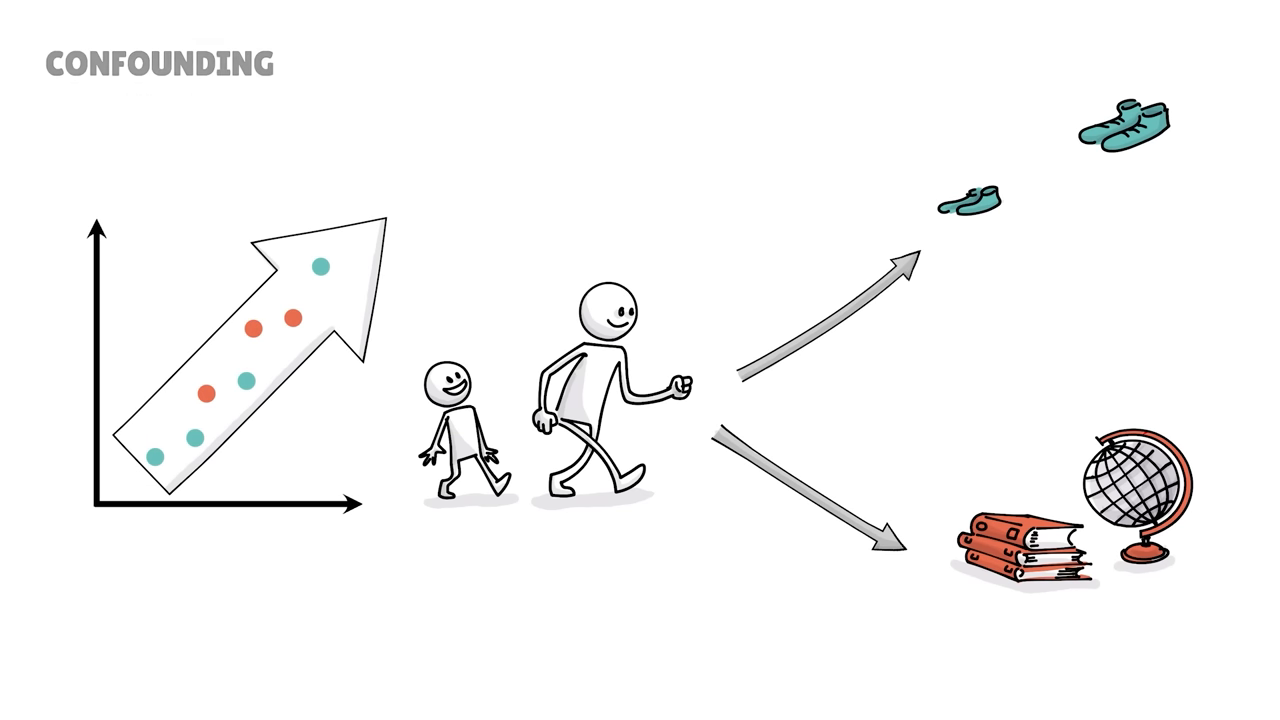
Children with larger shoes tend to read better. Should we buy children bigger shoes to improve their reading?
Of course not. As children grow older, their feet grow and their reading skills develop. Age helps explain both changes.
This is confounding: a third factor influences the two things we are comparing, creating an association that can look like a direct causal relationship.
2. Reverse Causality: The Arrow May Point the Other Way
Suppose people who buy ice cream report feeling happier. We might conclude that ice cream makes people happy.
But perhaps happy people have more reasons to celebrate and buy ice cream. The relationship could run in the opposite direction from the one we first imagined.
Reverse causality reminds us that an association alone cannot tell us which variable is the cause and which is the effect.
3. Spurious Correlation: A Pattern May Be Coincidental
Some patterns appear without a meaningful causal connection. A playful example compares declining pirate numbers with rising temperatures.
Put the two trends on a graph, and they may appear related. But the pattern provides no plausible reason to conclude that fewer pirates make the planet hotter.
A spurious correlation can look impressive while offering no useful causal explanation. A graph is a starting point for investigation, not the end of it.
Three Questions to Ask About Any Causal Claim
Before accepting that A causes B, ask:
- Did A happen before B? A cause must come before the effect it is supposed to explain.
- What could cause both? Look for a third factor that might explain the association.
- Is there a plausible path from A to B? Consider the mechanism through which one could affect the other.
Take the claim that students who sleep more get better grades.
First, does the longer sleep come before the improvement in grades? Second, could organized students both sleep more regularly and spend more time studying? Third, could sleep improve attention and memory in a way that helps explain academic performance?
These questions make the claim more precise. They do not settle it. A plausible mechanism is a reason to investigate, not proof that the proposed cause explains the result.
How Researchers Investigate Causation
To move beyond a suggestive pattern, researchers need comparisons that help separate a possible cause from competing explanations. Three important approaches are randomized controlled trials, natural experiments, and longitudinal studies.
Randomized Controlled Trials
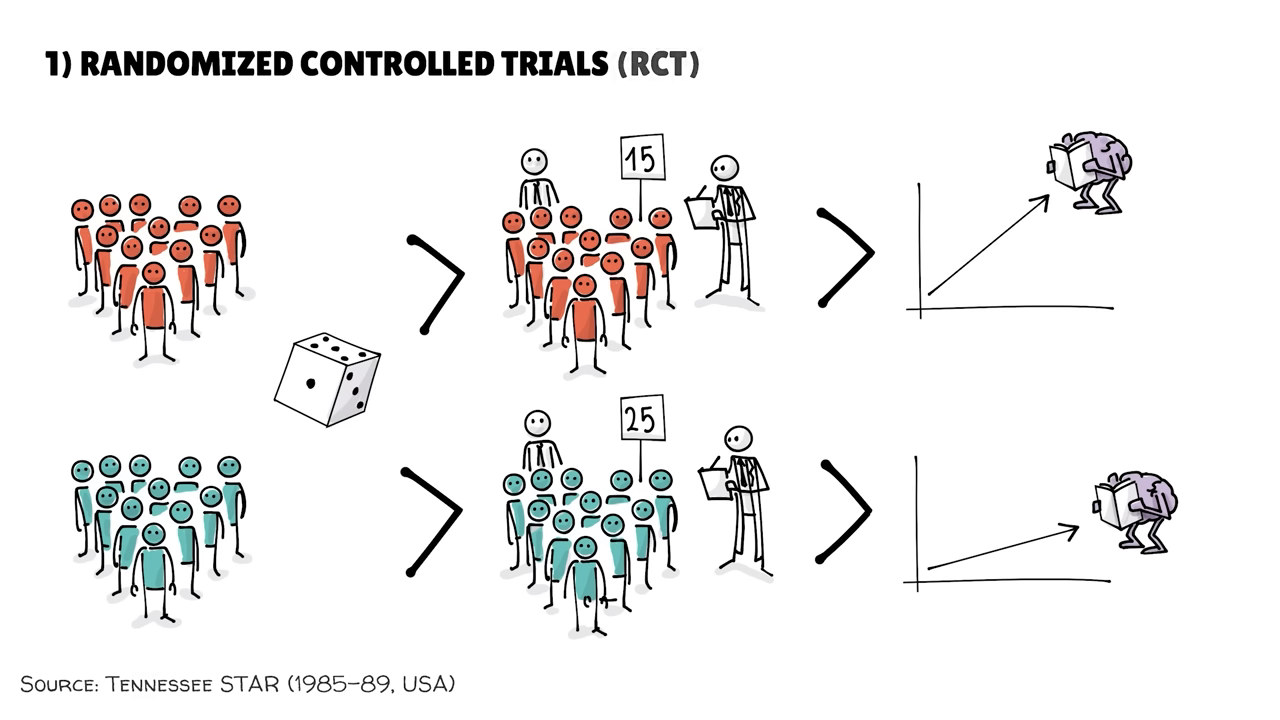
In a randomized controlled trial, or RCT, researchers randomly assign people to different conditions and compare what happens.
For example, students might be assigned to classes of 15 or classes of 25. Researchers then measure learning to find out whether one group progresses faster than the other.
Random assignment helps make the groups comparable, reducing the risk that preexisting differences explain the outcome. Ideally, other researchers repeat the experiment to see whether the result holds up. This is why well-designed RCTs are often considered the gold standard for testing causal effects.
Natural Experiments
A natural experiment uses a real-world event that creates groups or conditions resembling those of a randomized experiment. Researchers do not assign the event themselves.
The Mariel Boatlift offers an example. In 1980, about 125,000 Cuban refugees arrived in the Miami area over a short period. The sudden arrival of so many potential workers raised concerns about local jobs and wages.
Economists compared Miami’s experience with that of similar cities. David Card’s study of the Mariel Boatlift found little effect on local wages. The key was not simply observing Miami after the event, but comparing its outcomes with places that had not experienced the same influx.
Longitudinal Studies
Longitudinal studies follow the same people over many years. This helps researchers establish the order in which events happen and examine how earlier experiences relate to later outcomes.
The Grant Study began in 1938 and followed 268 Harvard-educated men. Its findings linked alcoholism with marital breakdown and associated warm childhood relationships with mothers with higher earnings later in life.
Following people over time provides information that a single snapshot cannot. Still, establishing that one event happened first does not automatically prove it caused what followed. Confounding remains a concern, so these findings require careful interpretation.
Compare Apples With Apples
Across these approaches, one principle keeps returning: make the comparison as fair as possible.
Grouping people by factors such as age, income, or lifestyle can help researchers compare people in similar circumstances. Otherwise, differences between groups may be mistaken for the effect of the factor being studied.
Try It Yourself: Do More Books Mean Better Grades?
Imagine this headline: “Kids with more books at home do better in school.”
Before concluding that more books cause better school performance, apply the three questions:
- Were the books present before the children’s performance improved?
- What other factors could explain both the number of books at home and school performance?
- Through what process might access to books improve learning?
Then consider how you would test the claim. What would you measure? Which children would you compare? How would you distinguish the effect of books from the influence of other differences between their homes?
The goal is not to dismiss every correlation. Patterns can reveal useful clues. The goal is to recognize the difference between finding a pattern and explaining its cause.
|